
Ever heard the term "IPO" thrown around in financial news? Let's break down what it means and why it might be interesting for systematic traders.
What Exactly is an IPO?
"IPO" stands for "Initial Public Offering." It's the very first time a private company offers its shares (stock) to the public on a stock exchange.
Think of it as a company's big debut on the public stage. Before an IPO, a company is usually owned by its founders, early investors (like venture capitalists), and maybe a few other private backers. The IPO process allows the company to raise money from the general public by selling shares. It also gives those early investors and founders a chance to cash in on some of their investment.
As traders, we often look for opportunities where the market isn't perfectly efficient. These situations often pop up when emotions are running high – and a company going public is definitely one of those times!
There's usually a lot of buzz around companies having their IPO. Crucially, their initial market price isn't established; the market must discover it. This means stocks right after an IPO often have a higher chance of making big, fast moves (what traders call "momentum") compared to more established stocks.
The real edge in IPO trading isn't found in headlines, but in systematically identifying and exploiting the momentum patterns that data reveals.
How to Trade IPOs
There are a couple of ways to approach trading IPOs:
- Get in on the Offering: When a company decides to go public, investment banks and advisors help set an initial "offer" price for the shares. Some brokers allow their clients to buy shares at this price before they hit the open market. Many traders try to buy during the IPO offer phase hoping to profit from the "IPO pop" – the difference between the offer price and the price where the stock actually starts trading on the exchange. Often, due to high demand, stocks open higher than their initial subscription price. For instance, Nasdaq statistics indicated that the average first-day return (the 'IPO pop') for traditional IPOs in the notably strong market of 2020 was around 38%.
- Trade After the Stock Starts Trading: You can also wait until the stock is actively trading on the exchange and then decide to buy (or potentially sell short, though that's riskier and frequently difficult or impossible immediately post-IPO due to share borrowing constraints). This is an approach anyone can take using standard trading tools. Compared to well-established stocks, traders can benefit from the increased volatility and the simple fact that the market is still trying to determine the company's fair value. This sometimes leads to newly listed stocks seeing huge gains and strong trends.
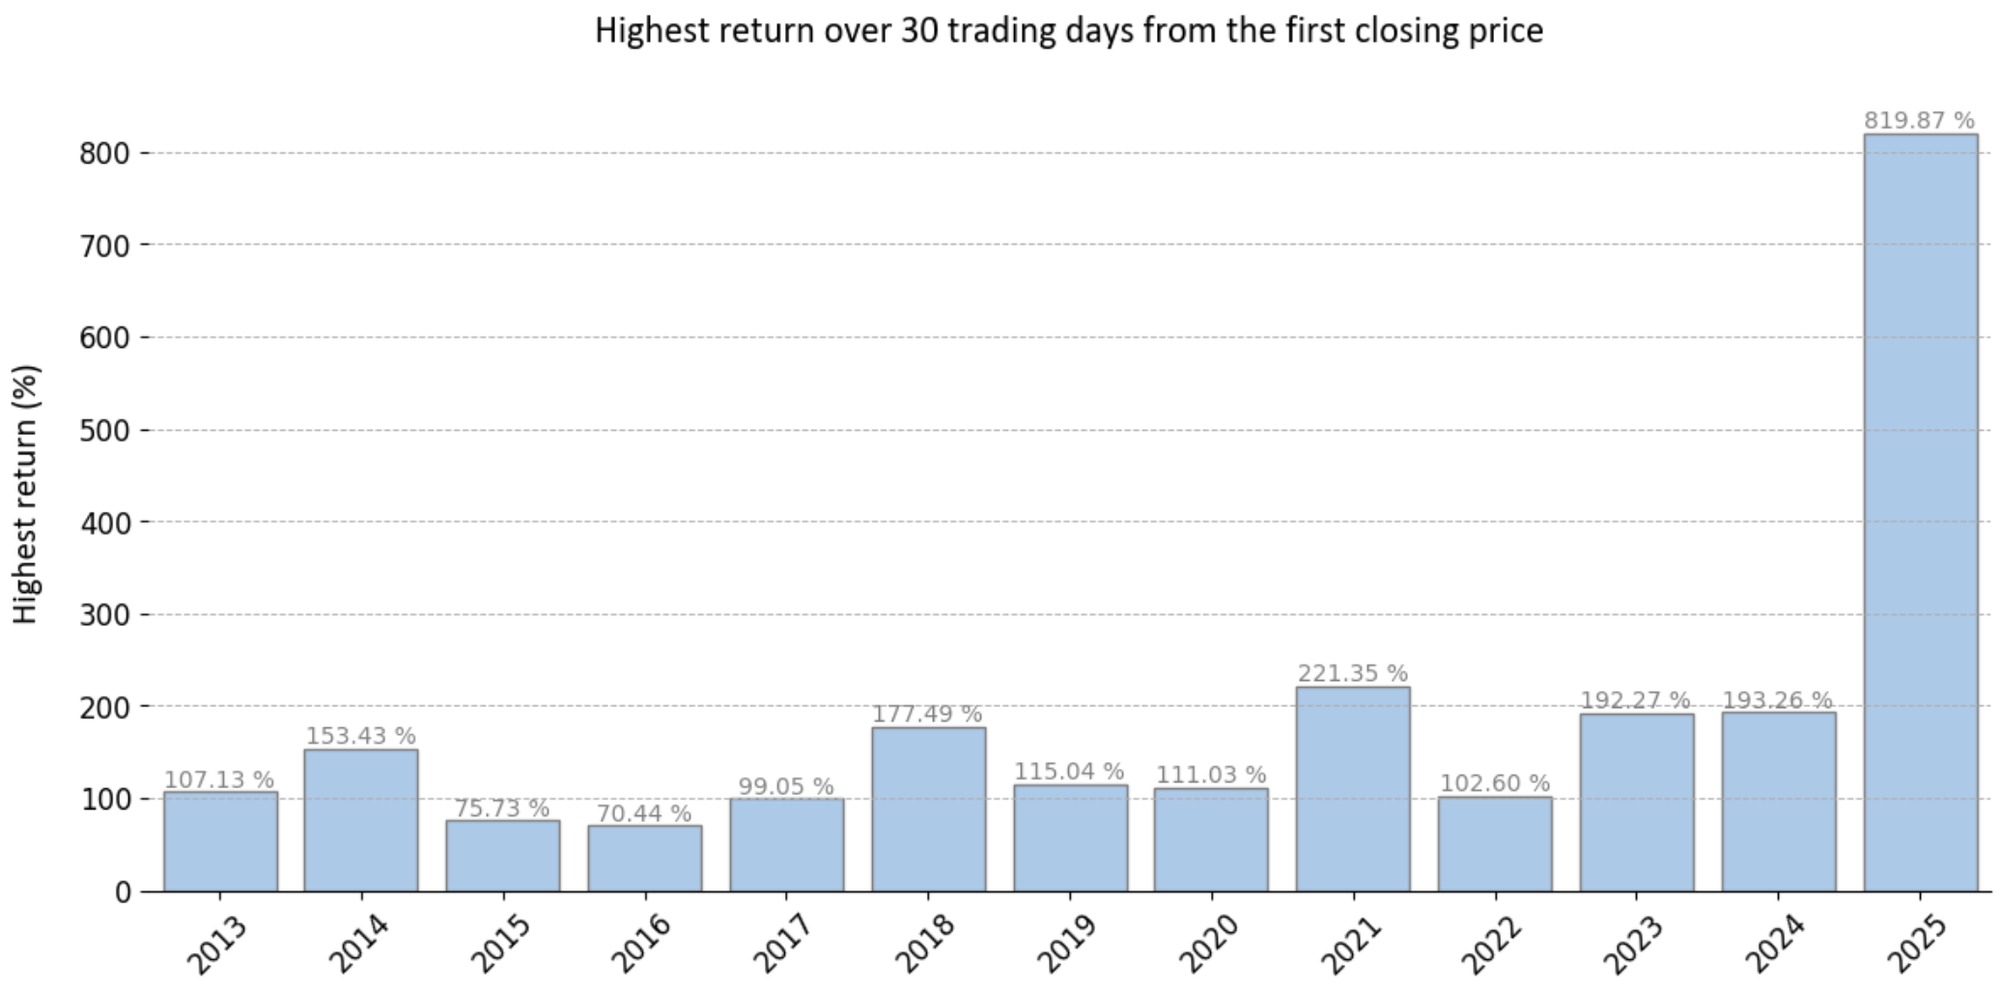
The graph above shows top performing stocks that were actually tradable (filtering for those with a Price * Volume greater than $10,000,000 on their first day). You can see that in recent years, almost every year featured at least one stock that gained over 100% within a month after its first trading day closed.
How Many IPOs Happen Each Year?
So, how many potential trading opportunities are we talking about?
Even if we apply our liquidity filter (Price * Volume > $10 million), we're still looking at dozens, sometimes hundreds, of potential trades each year.
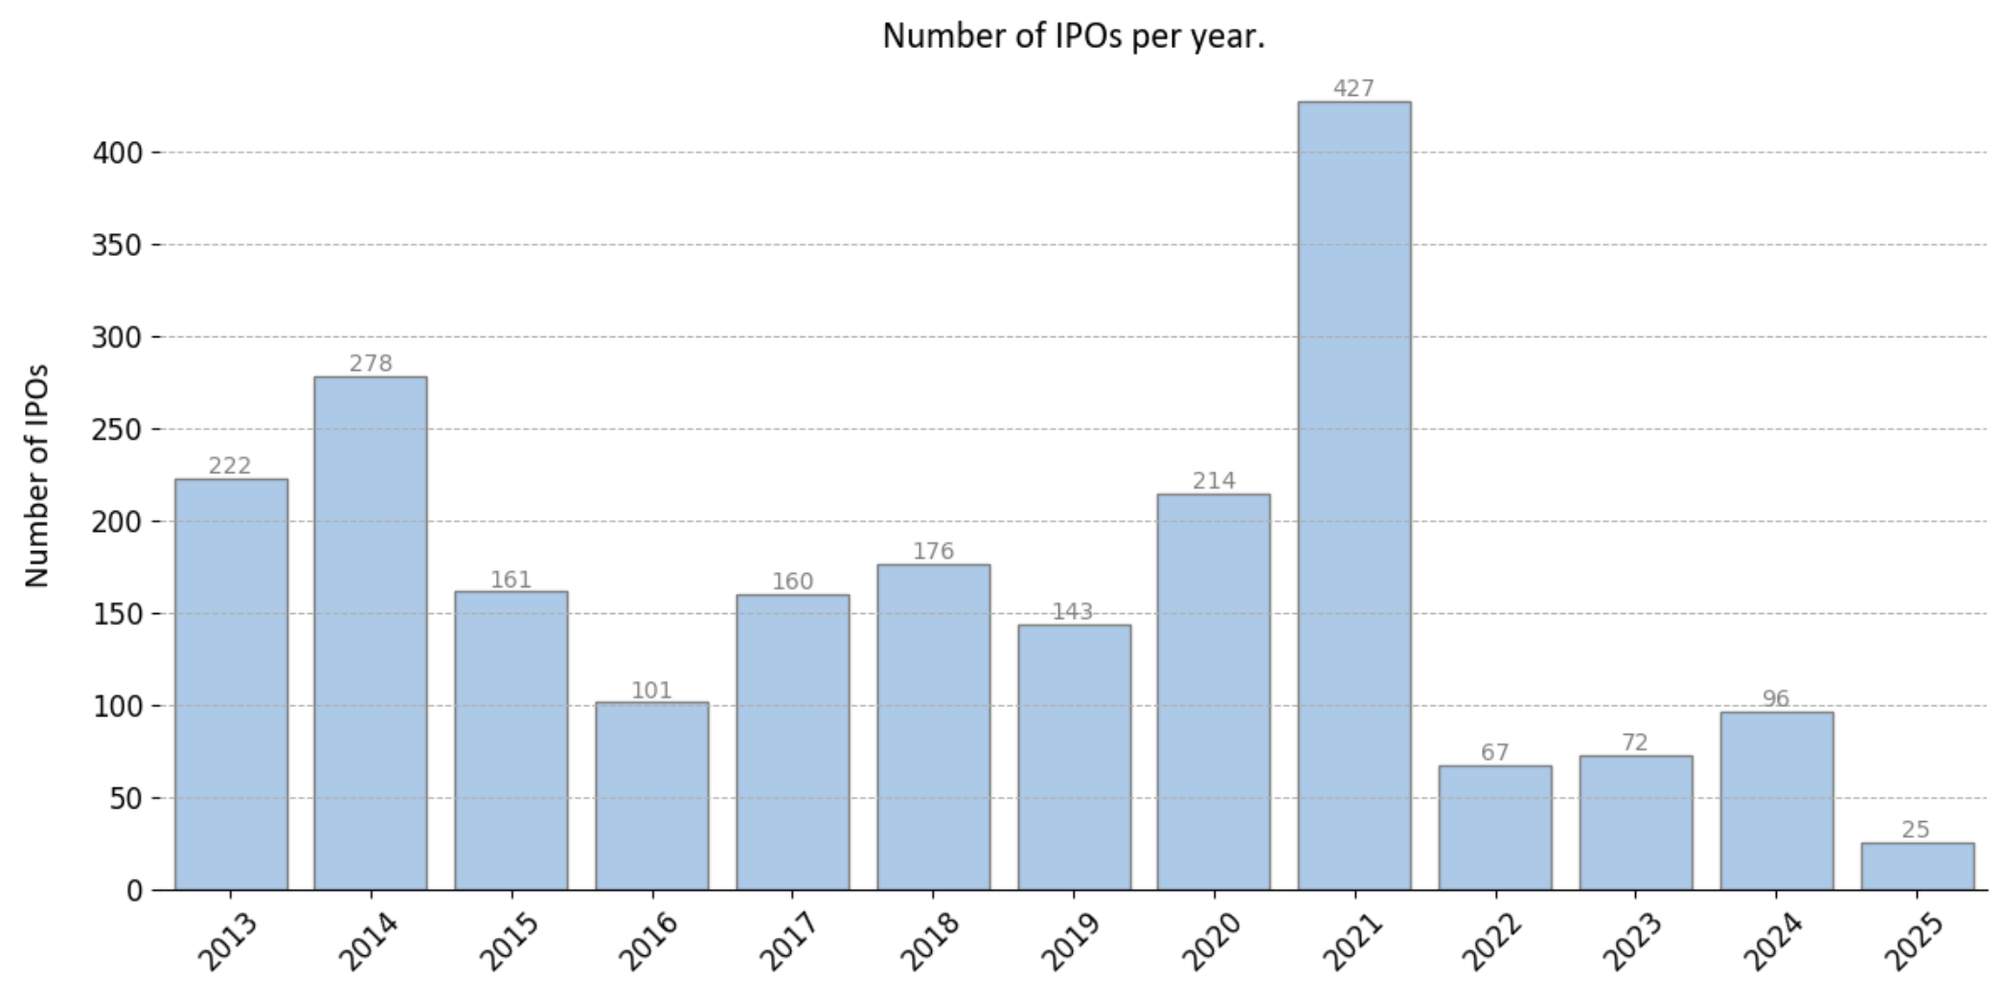
Historical data shows fewer IPOs in recent years, especially when the overall stock market was declining. However, there's still a decent number of potential signals.
How Do Stocks Typically Behave After an IPO?
Looking at the graph of biggest winners might make you think that stocks generally go up after an IPO, and maybe just buying and holding is the way to go.
Unfortunately, it's not usually that simple (remember, the earlier graph showed the best performers). Here's what the average performance looks like 30 trading days after the first opening price:
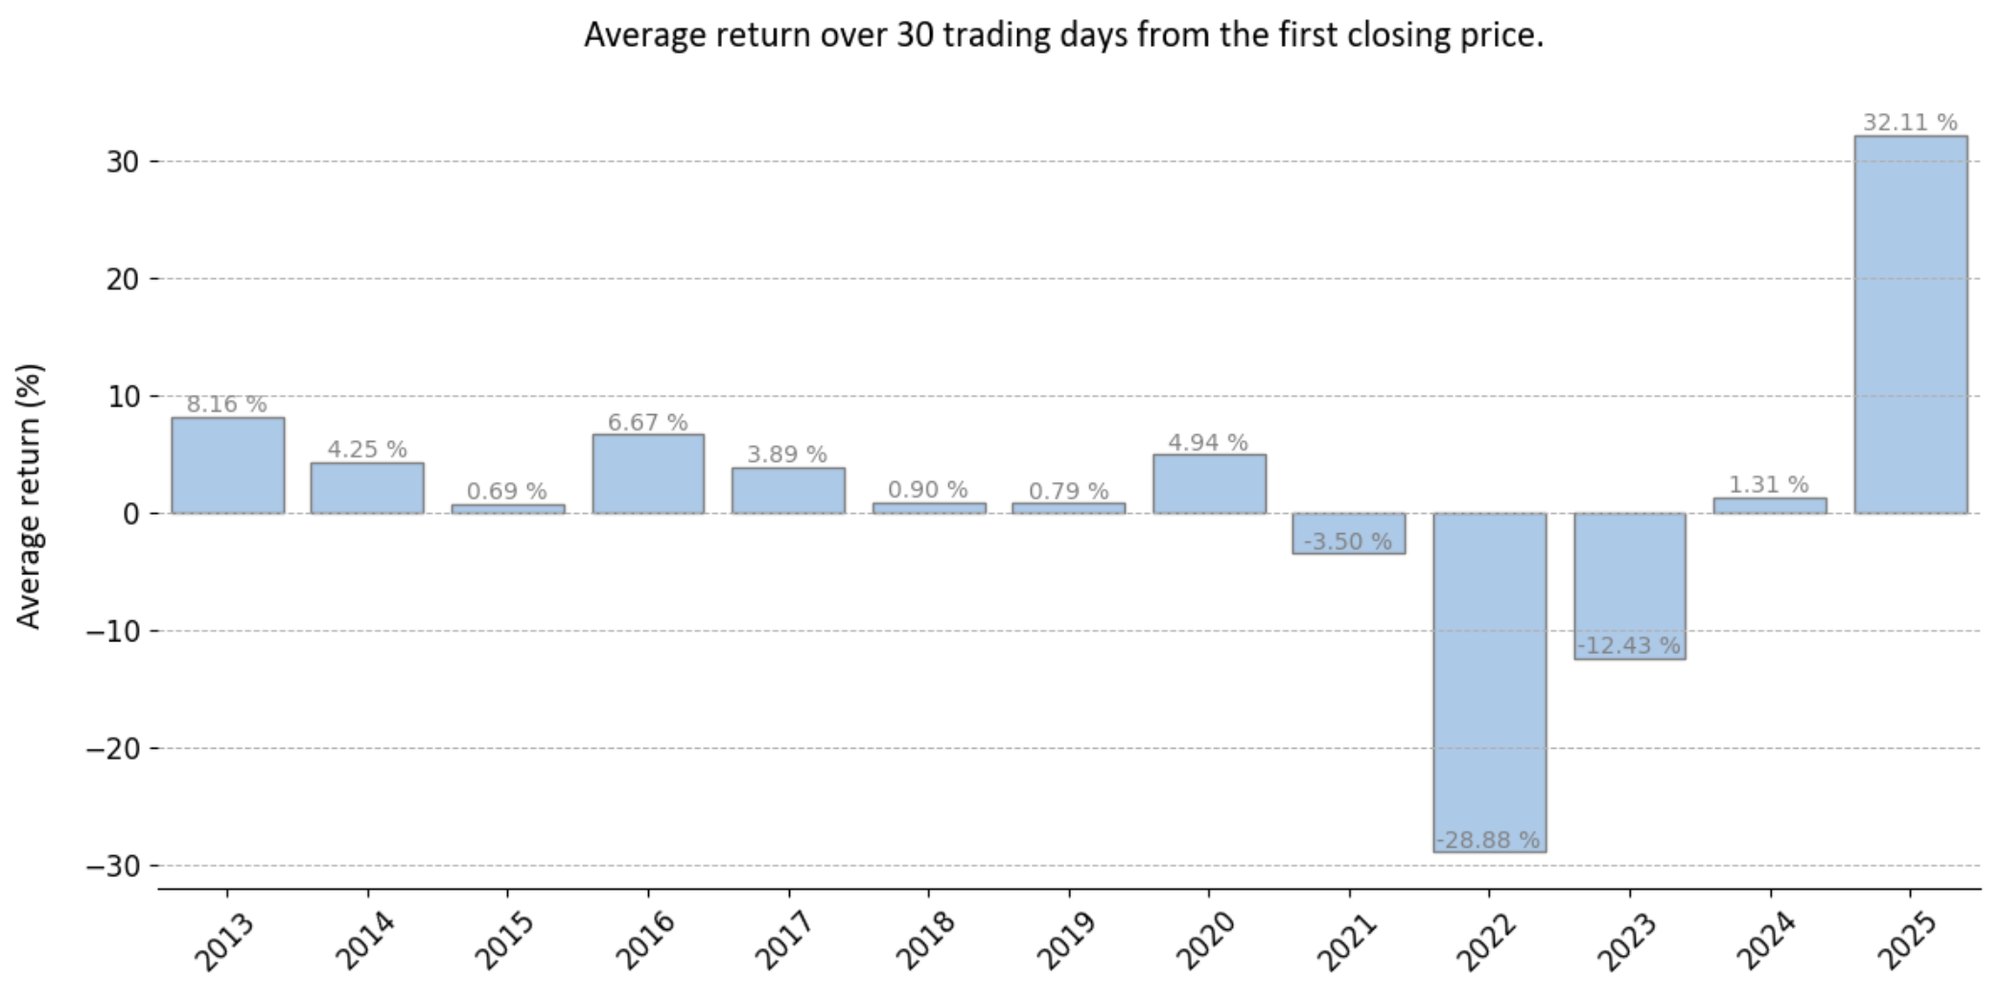
As the graph illustrates, the average performance is inconsistent and often trends near zero or negative shortly after the IPO. This makes it clear that blindly buying every IPO and holding on won't likely lead to consistent results. We need a smarter approach.
SPAC IPOs vs. Traditional IPOs: An Important Difference
Before we dive into building a smarter trading system, there's a crucial distinction to understand: traditional IPOs vs. SPACs.
Normally, we think of an IPO as a specific company starting to trade on an exchange. You can often spot it on a chart because the price history for that stock ticker starts on a particular day. However, there's another way companies go public: through a SPAC (Special Purpose Acquisition Company).
While both traditional IPOs and SPACs aim to get a company listed on an exchange and raise capital, the process is very different.
A SPAC, sometimes called a "blank check company," is essentially a shell company created purely to raise money through its own IPO with the sole purpose of eventually finding and acquiring an existing private company. Investors in the SPAC IPO buy shares without knowing which specific company will eventually be acquired. Initially, it is essentially an empty shell company. Later (often months or even years later), the SPAC identifies a target company. If the SPAC's shareholders approve the acquisition, the target company merges with the SPAC and effectively becomes publicly traded.
Why does this matter for trading? It's vital to distinguish between traditional IPOs and SPACs when looking at charts. The initial price history of a SPAC before it merges with a target company has nothing to do with the actual operating business that eventually goes public.
Identifying SPACs in Historical Charts
You can identify SPACs using historical data tools. For example, Norgate Data (requires at least the Platinum subscription) allows this. Here's a simple indicator code snippet (for Amibroker) that plots whether a company was a SPAC:
#include_once "Formulas\Norgate Data\Norgate Data Functions.afl"
blankcheckcompany = NorgateBlankCheckCompanyTimeSeries();
Plot(blankcheckcompany,"SPAC",colorBlack,styleHistogram);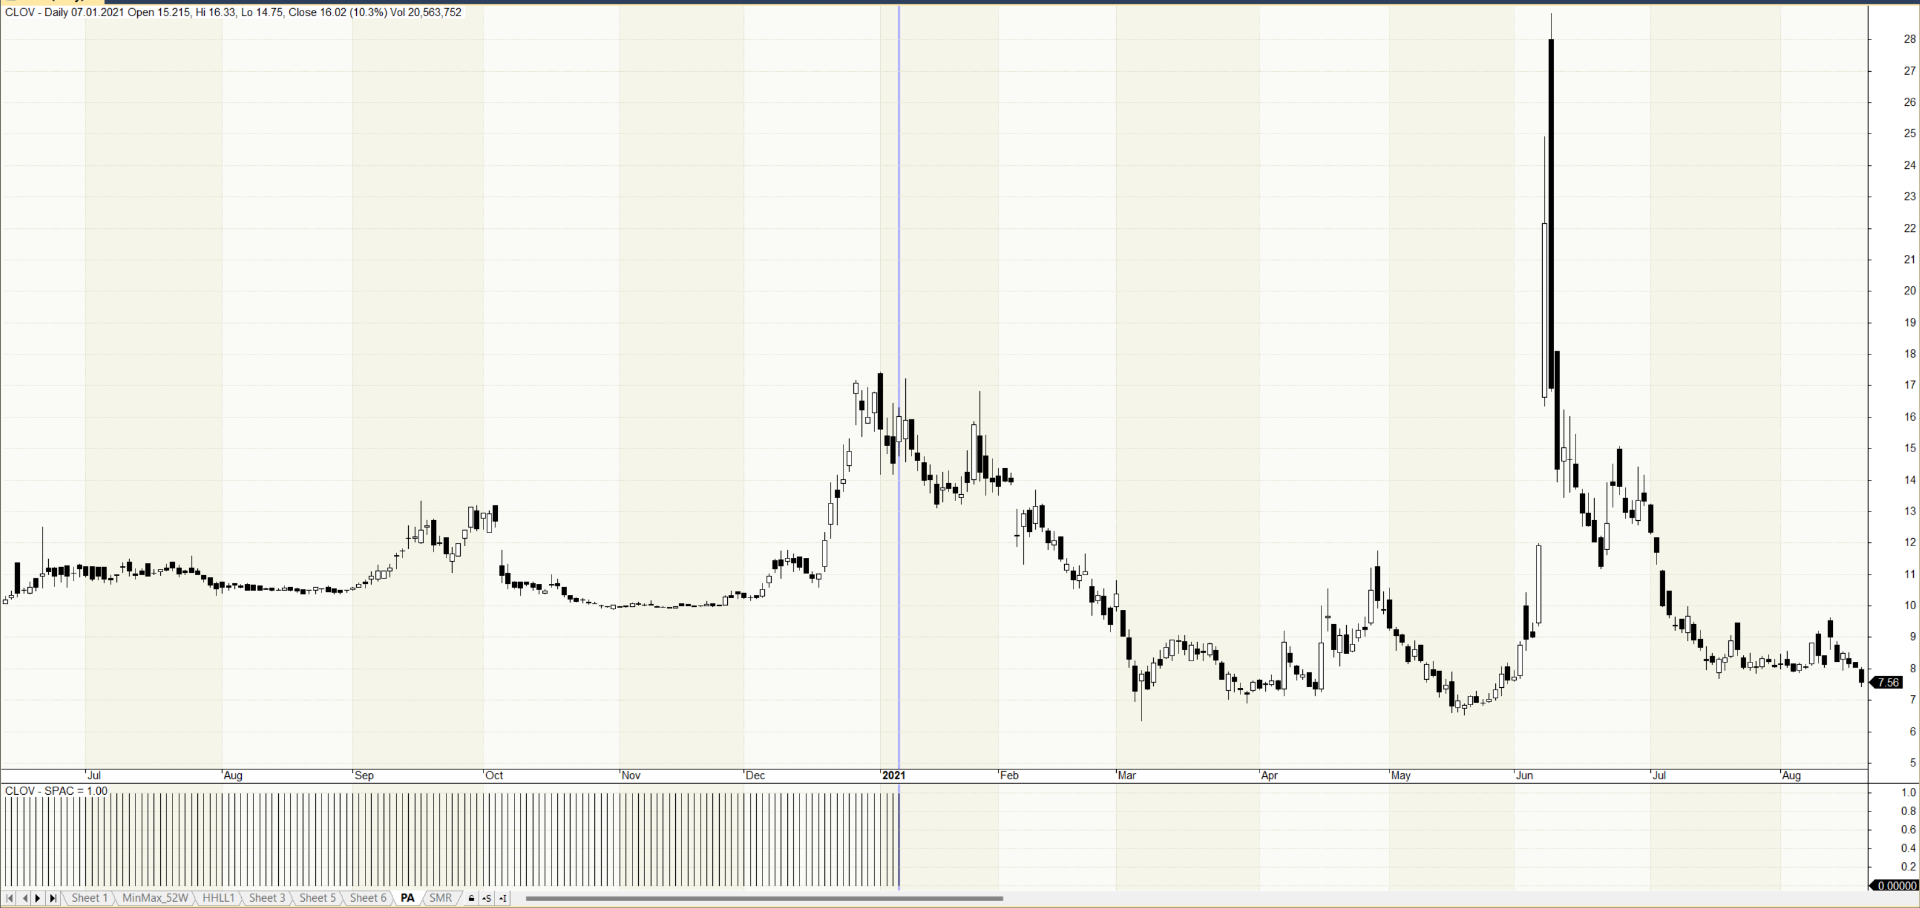
The screenshot would show the price history of Clover Health Investments (CLOV), which went public via a SPAC in 2021. The chart history from 2020 (where the indicator at the bottom would show activity) doesn't relate to CLOV itself, but to the "blank check" investment vehicle before it merged with Clover Health.
A Simple Trading Plan Based on IPOs
So, if we want to systematically trade IPOs, we'll likely want to focus on:
- New companies (only a short history on the chart).
- That are not SPACs.
- Probably looking to buy (shorting newly public stocks seems very risky, and shares might not even be available to borrow for shorting).
One of the simplest approaches is momentum trading.
This makes sense given what we saw earlier – some companies do experience strong trends after their IPO. A potential strategy could be to buy the stock when it shows initial signs of strength.
Here’s a specific plan:
- Universe: Company trades on a US exchange and is NOT a SPAC.
- Liquidity Filter: On its first trading day, Price * Volume > $10,000,000.
- Entry Signal: Buy at the market open on the day after the stock closes at a new all-time high for the first time since its IPO.
- Timing Window: Only look for this signal within the first 100 trading days of the stock's life.
Risk Management:
- Stop-Loss: Sell if the price drops 20% from the entry price.
- Profit Target: Sell if the price rises 30% from the entry price.
- Position Sizing: Trade a maximum of 5 positions at once, allocating 20% of your capital to each. If there are more signals than available slots, prioritize signals based on the highest current average (Price * Volume).
Aside from the liquidity filter and the timing window, the core entry signal (first new all-time high close) is intentionally simple and doesn't involve optimizable price-level parameters. That's a big plus – fewer variables often mean a more robust system. The risk management (stop-loss/profit target) can be optimized, and this represents a basic setup.. For live trading, one might consider using a trailing stop-loss instead of a fixed one.
Backtesting the Mechanical IPO Strategy
Does this simple approach actually work? A backtest suggests there might be a valuable edge here.
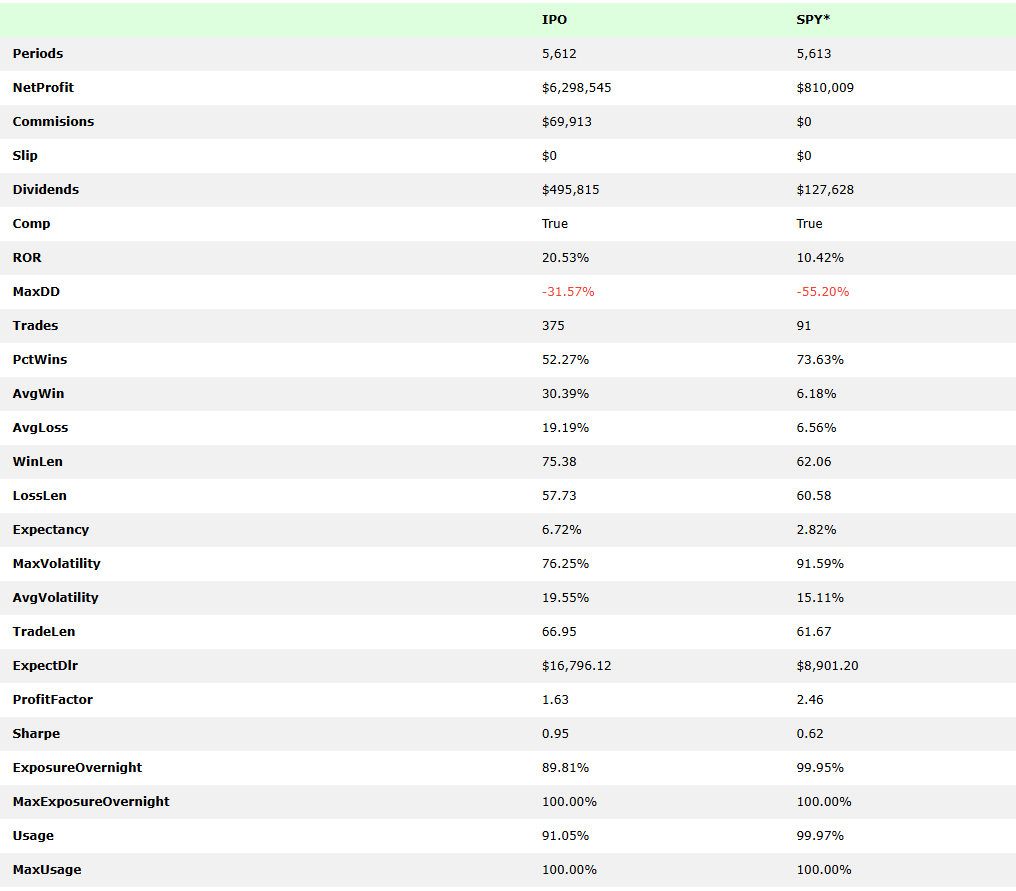
A backtest from 1/2/2003 to 4/25/2025 showed this strategy hypothetically achieved an average annual return of 20.53% with a maximum drawdown (peak-to-trough decline) of -31.57%. This is after accounting for estimated commissions (based on Interactive Brokers).
The average trade yielded a very healthy +6.72% profit, with trades lasting an average of 67 days. The Sharpe ratio (a measure of risk-adjusted return) was 0.95.

It is important to remember that backtested performance is hypothetical and does not guarantee future results. Market conditions can change, and real-world trading involves factors like slippage that may not be fully captured.
Here are the hypothetical results shown graphically:
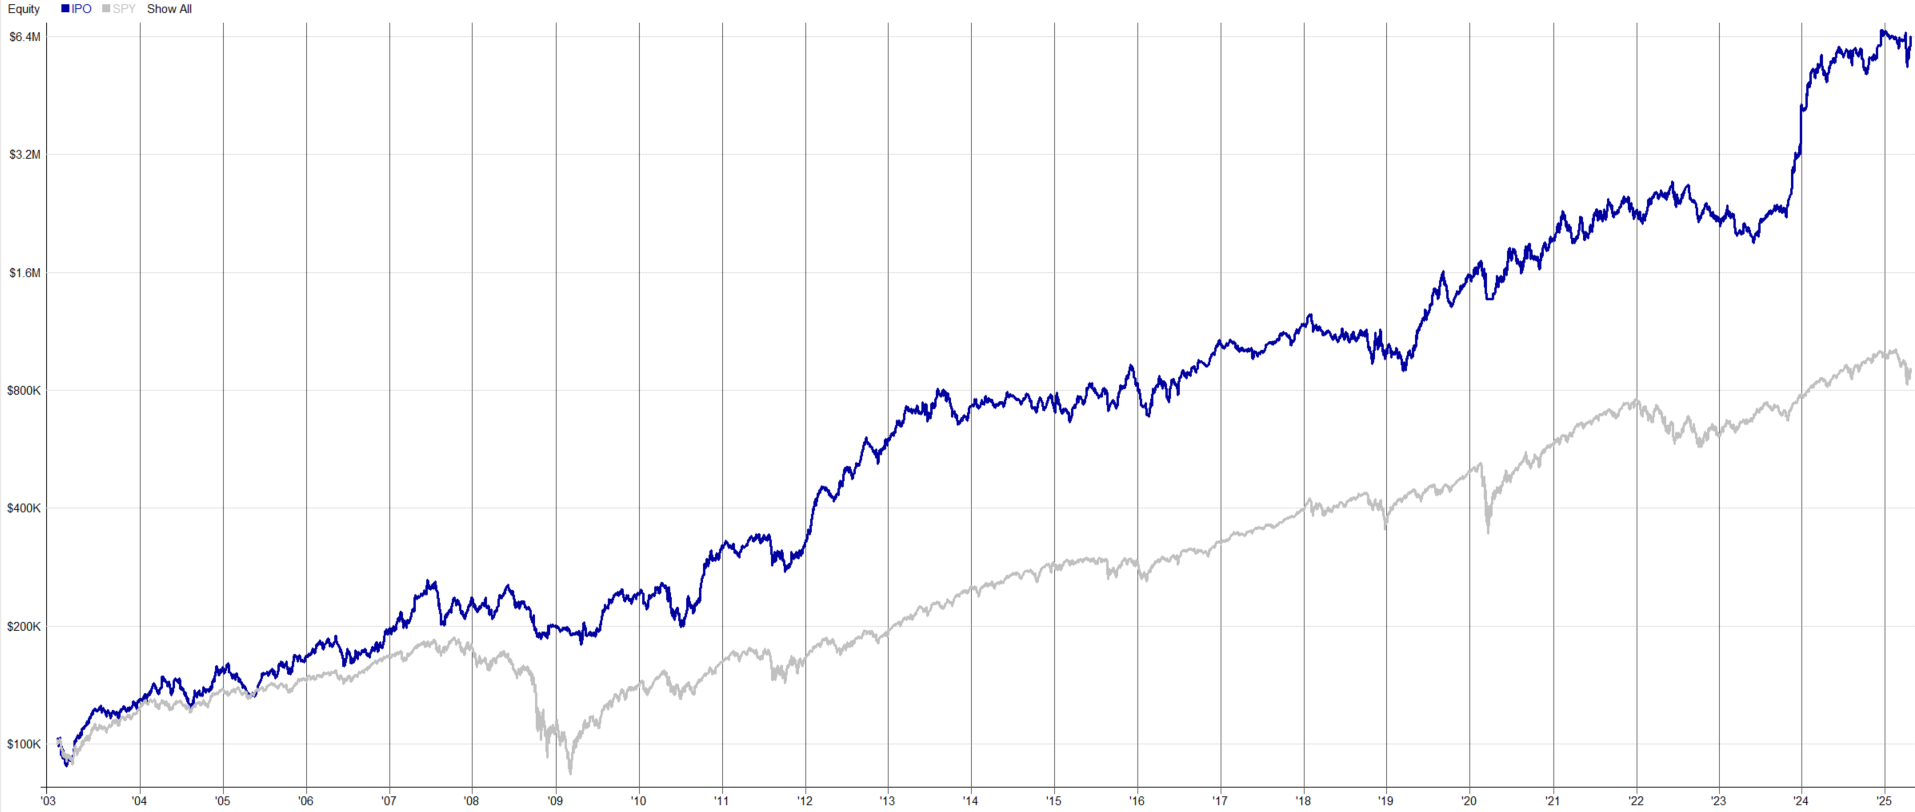
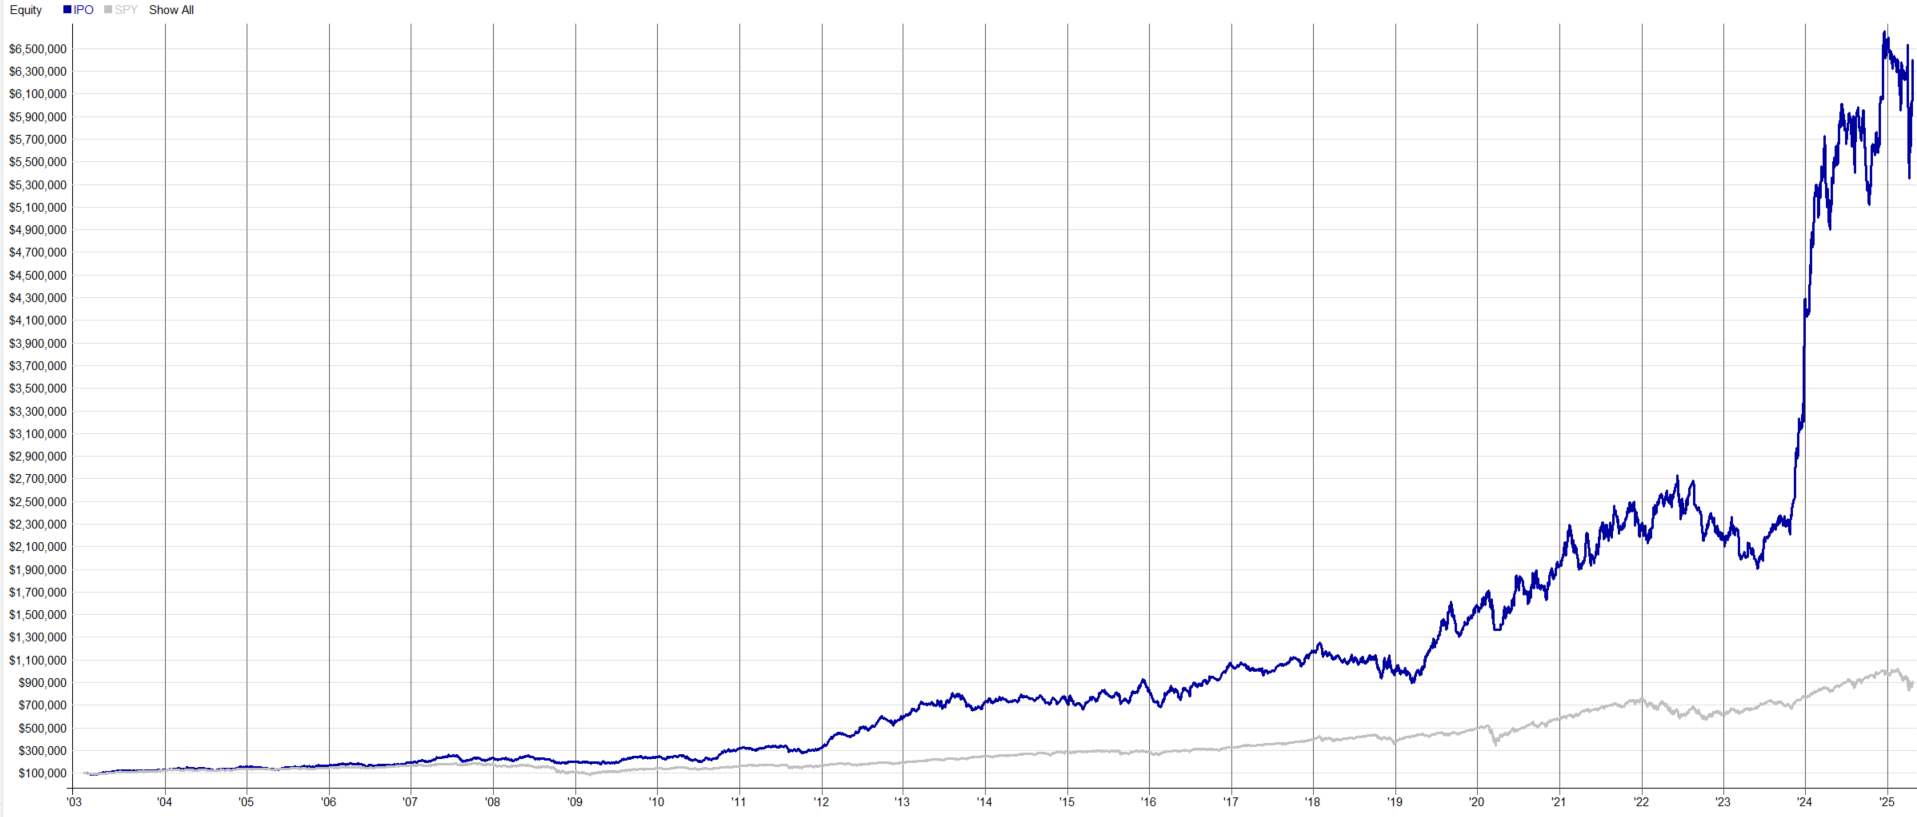
The second graph, using a standard scale, really highlights the huge difference in absolute returns between the strategy and simply holding the S&P 500 index over the tested period.
Mechanical IPO Trading – Key Takeaways
This simple example strategy demonstrates that there could be a significant edge in mechanically trading trends in recent IPOs (excluding SPACs). Even with very straightforward rules, the backtest indicates potential for consistent performance over the historical period tested. This suggests that the period shortly after a traditional IPO is an interesting area for systematic traders to explore further.
![Day Trading Volatility Breakouts Systematically [All Rules Included]](/content/images/size/w960/format/webp/2024/10/breakout-portfolio.jpg)

