
One of the traditional tactics in systematic stock trading is trading using short-term mean reversion strategies.
A mean reversion strategy buys stocks that have recently experienced a significant decline and short stocks that have undergone a significant rise.
Implied Volatility and Mean Reversion
We can define significant movements for timing mean reversion strategies using technical analysis. For example, we can use the RSI indicator. A typical long mean reversion strategy might buy stocks with an RSI(2) value less than 15 and exit the trade when the market closes with RSI(2) greater than 50.
But what about using implied volatility? For every stock that has options traded on it, we can obtain what's called implied volatility. Implied Volatility (IV) for a stock is calculated from at-the-money options with an average of 30 days until expiration. It's similar to the VIX but for a specific stock.
Implied volatility indicates the movements the market expects. The value is annualized. If the IV for a stock is 15.8%, it indicates that the market expects a low-to-moderate level of movement (volatility). This typically implies that traders expect the stock to remain relatively stable and have smaller price movements over the next year. The percentage can be interpreted as the expected one-standard-deviation range for the stock’s price, meaning there’s about a 68% probability the stock will fluctuate within 15.8% above or below its current price in a year.
Implied volatility itself can help us select markets that have a chance to move—which is what we need for mean reversion.
What is Daily Implied Volatility
If we divide the implied volatility by the square root of 252 (approximately the number of trading days), we obtain the daily implied volatility.
Daily implied volatility (IV) refers to the expected volatility or price movement of a stock on a per-day basis, derived from the annual implied volatility.
Daily implied volatility can indicate whether the current movement is more significant than traders expect. Such a movement has a higher chance of triggering emotions and can serve as a good basis for a mean reversion trade.
For example, if the annual implied volatility (IV) of a stock is 25%, the daily implied volatility would be calculated as:
\( \text{Daily IV} = \frac{25\%}{\sqrt{252}} \approx \frac{25\%}{15.8745} \approx 1.575\% \)
This means the stock is expected to fluctuate by approximately 1.575% on average each trading day. If the stock moves by 3% in a day, it's significantly more than the market expected.
Daily implied volatility tells us the approximate range of movement the market expects for that day (through option prices). If the market makes a larger move, it is significant and can serve well as timing for a mean reversion strategy.
Mean Reversion Strategy Based on Implied Volatility
With the information on whether the current movement was more significant than the market expected, we can now build a specific trading strategy.
Personally, I trade a live long mean reversion strategy that works with stocks that:
- Are from the Russell 1000 index
- Have an average volume of at least 200,000
- Have a price higher than $20
- Are in an uptrend: C>MA(C,200)
- Have a daily implied volatility of at least 0.55 (I want to trade stocks that are moving)
With approximately the following rules:
- The stock closes below its previous low.
- The stock makes a larger move that day than the daily implied volatility.
When these conditions are met, I buy the stock the next day using a limit order at a price below the current price. I exit at a profit target or a time-based stop-loss.
Strategy Backtest
To illustrate, I present the results of my backtest (without fully disclosing my detailed trading plan).
The backtest of this particular strategy is subject to survivorship bias. I download IV data from Interactive Brokers and do not have data for delisted stocks. Nevertheless, the backtest works with historical constituents of the Russell 1000 index (where it was possible to download IV data for the stock).
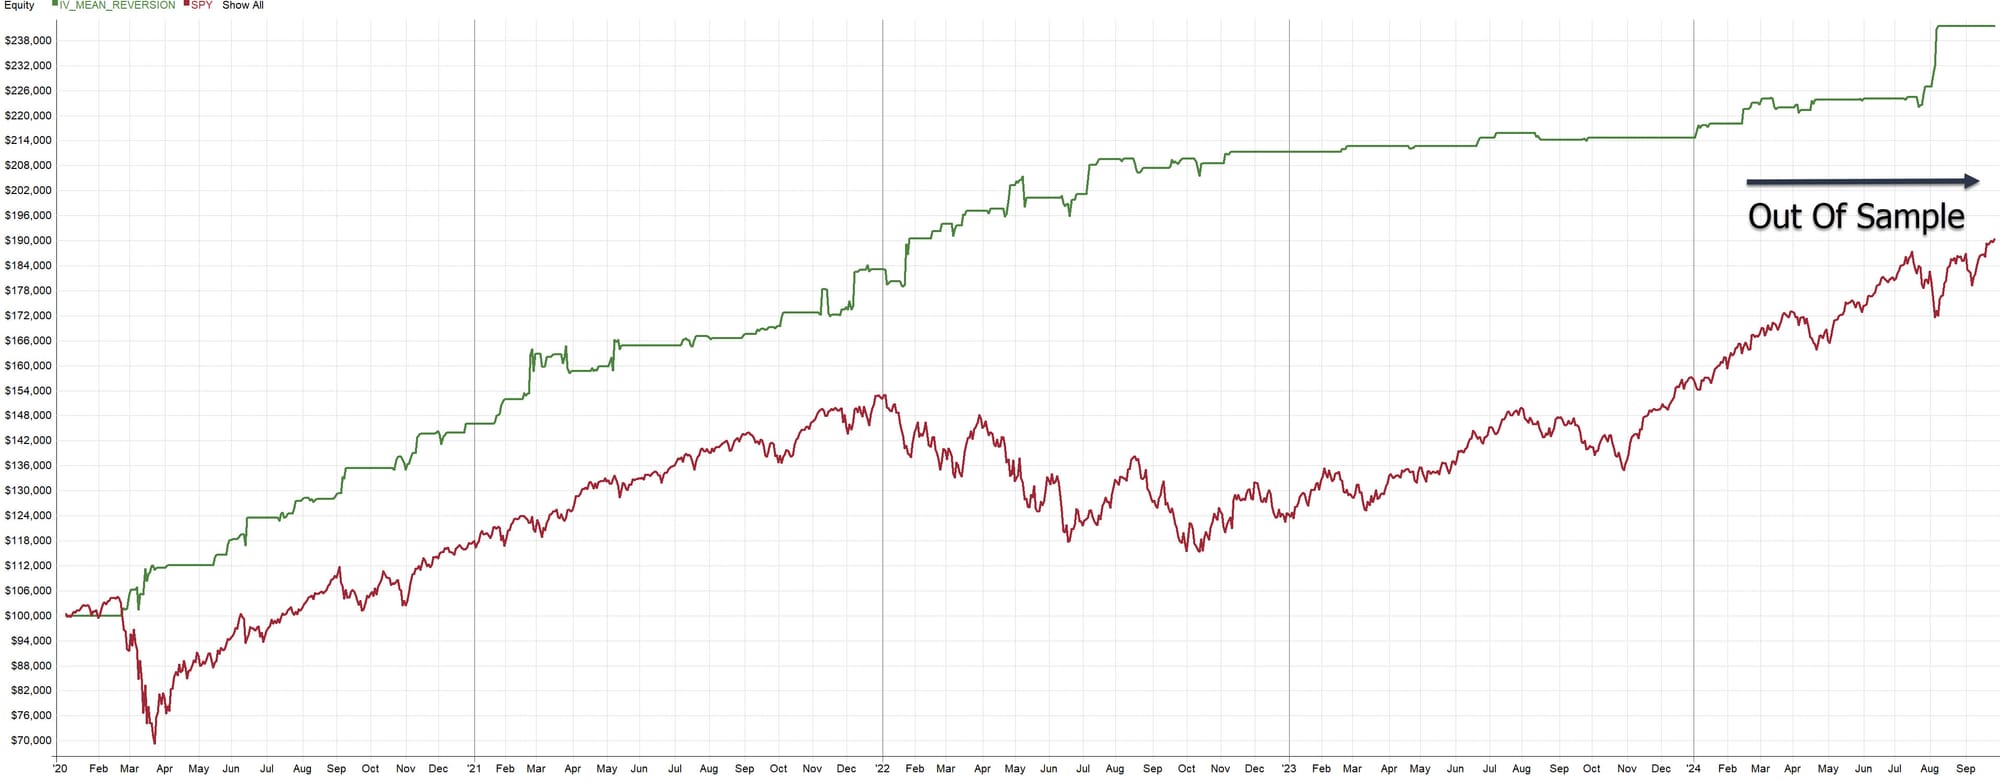
Notice that, unlike a typical mean reversion strategy based on technical indicators, timing long trades using implied volatility did not incur losses during periods when stock markets were generally declining. This is mainly because implied volatility itself was elevated during these times. The strategy thus required an even greater drop to generate a buy signal.
Here are the detailed backtest results for the period from January 1, 2020, during which the strategy executed 243 trades with a success rate of 74% and a positive risk-reward ratio (RRR):
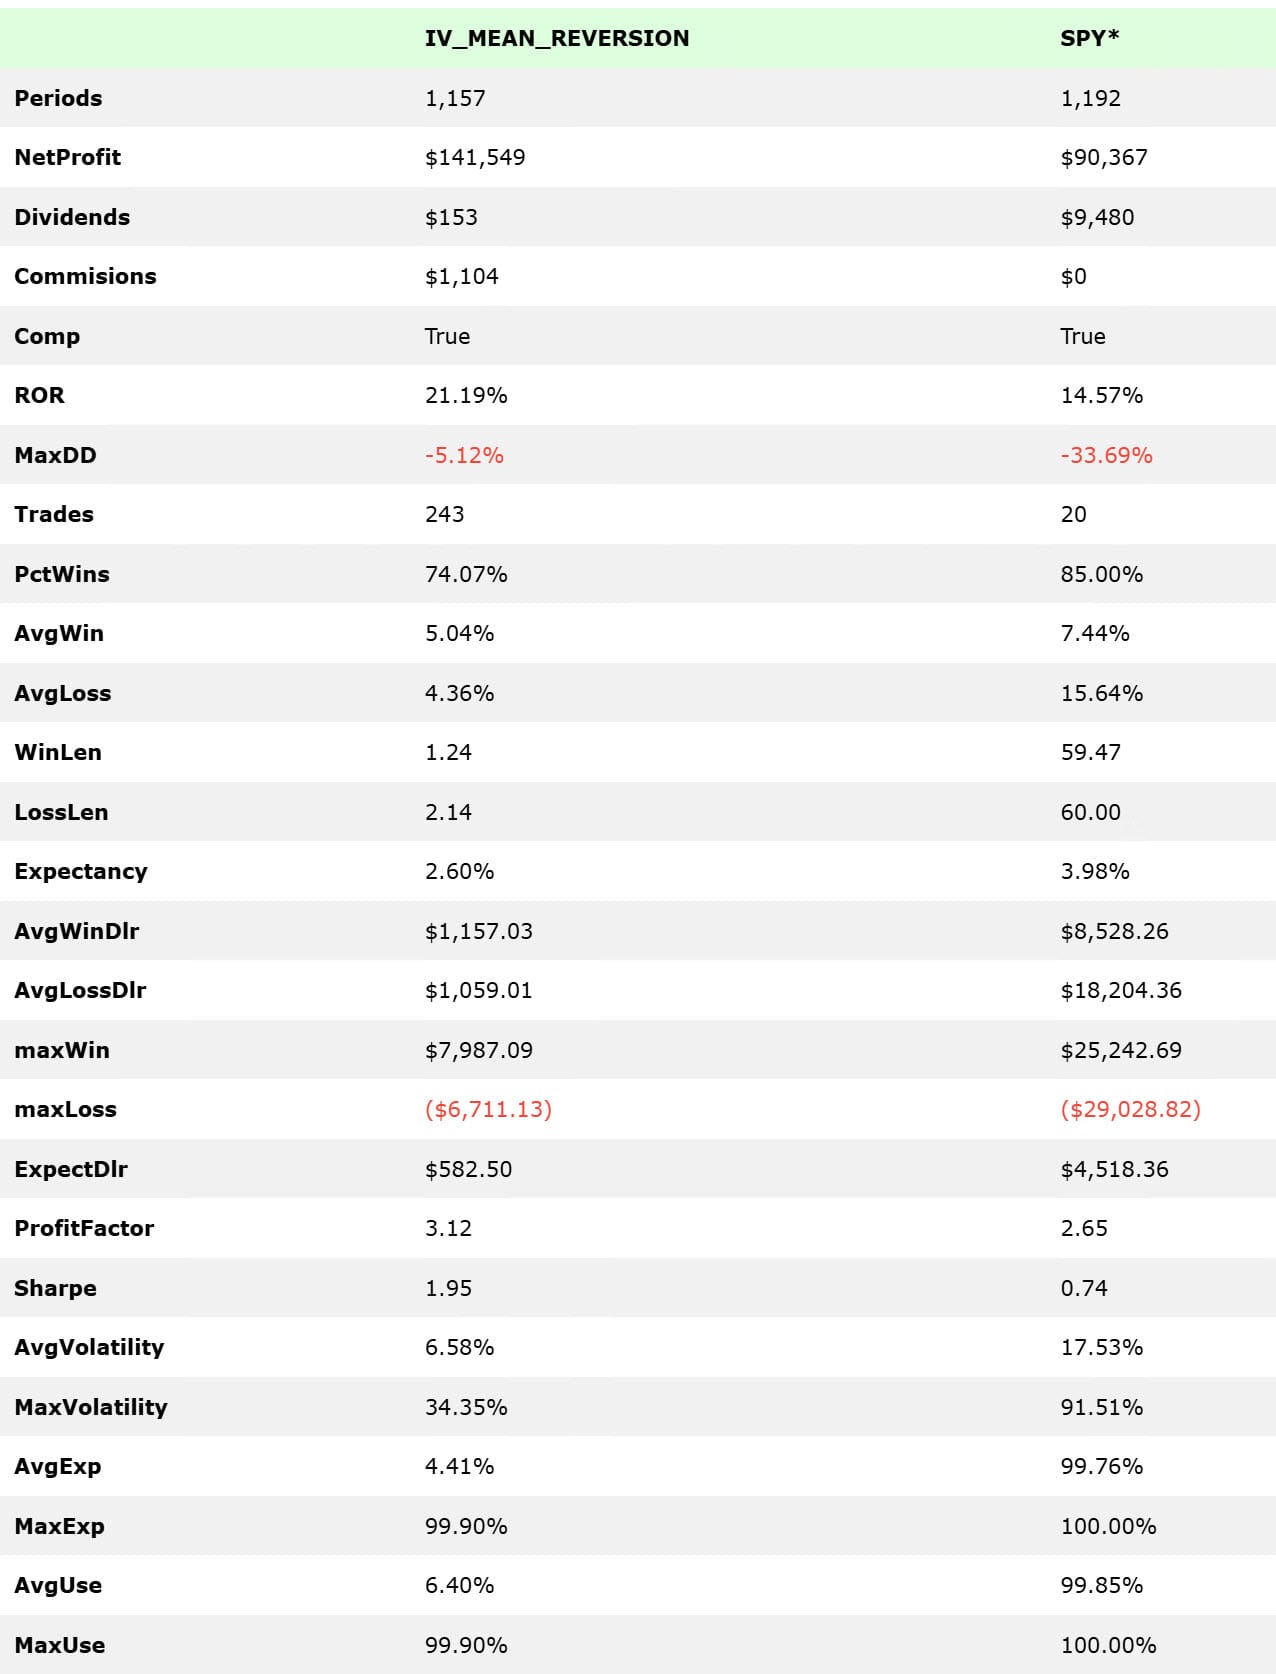
Even without using leverage, the strategy outperformed the index both in terms of returns (Rate of Return [ROR] of 21.19%) and drawdown (maximum drawdown of -5.12%, while SPY experienced a drawdown of -33.69%).
The strategy can also be traded on the short side. However, I personally trade it "long only."
Sample Trade of a Mean Reversion Strategy Timed with Implied Volatility
I have been trading this strategy live since the beginning of 2024. Here is what a typical trade I've executed looks like:
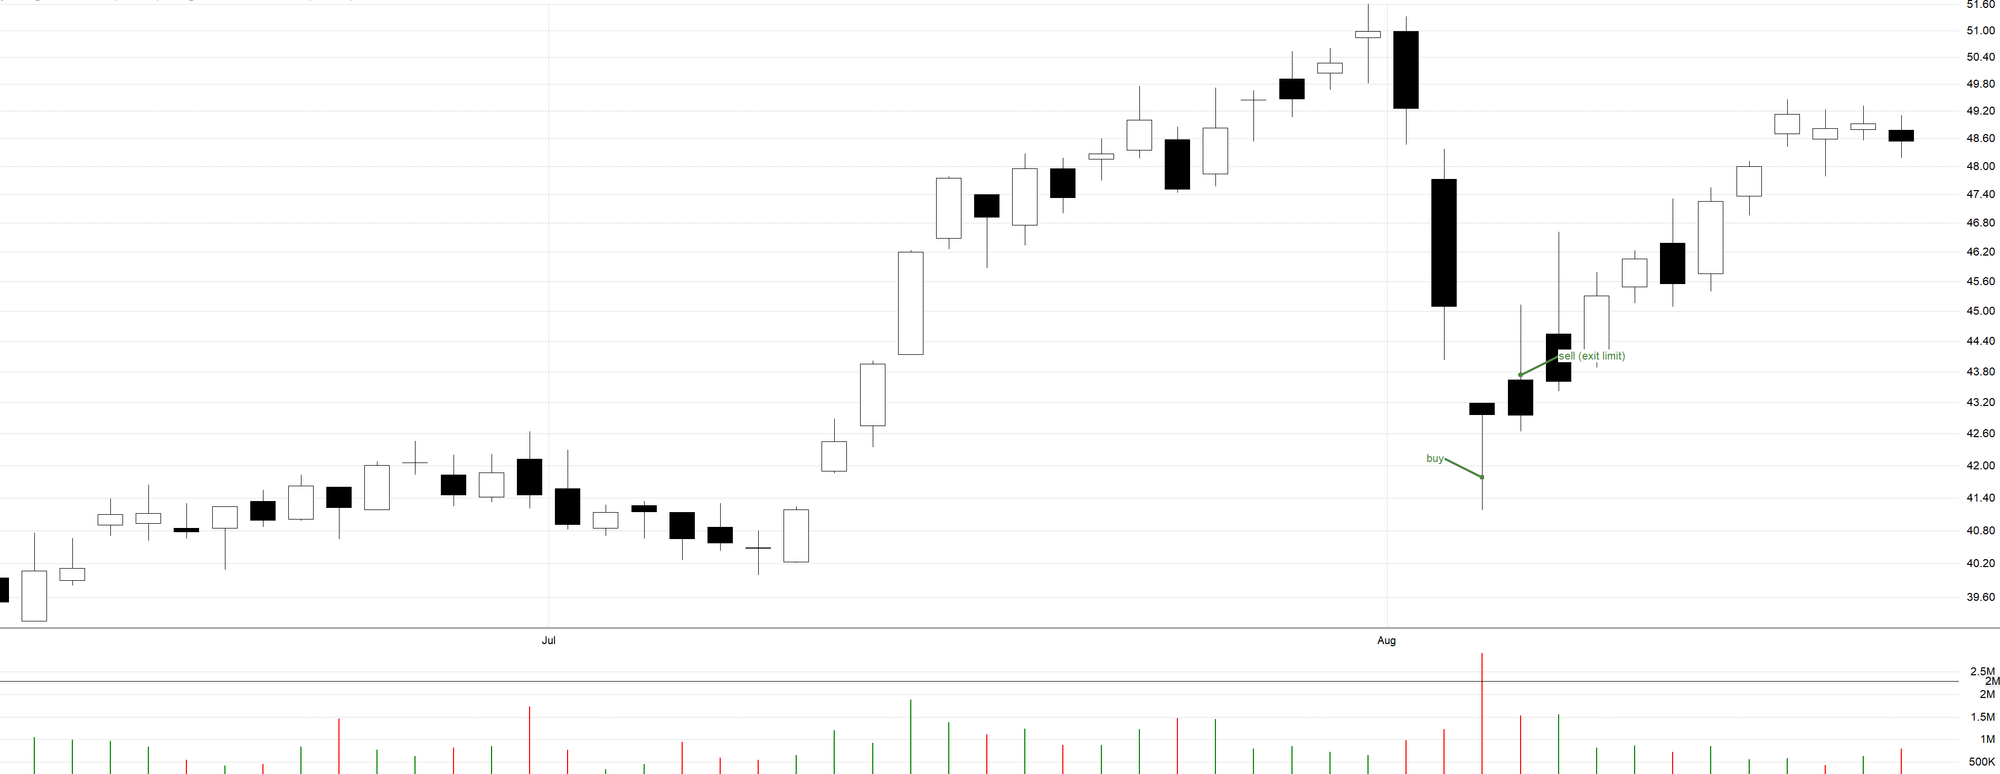
On August 2nd, the price drop of TPG stock significantly exceeded the daily implied volatility. The next day (August 5th, 2024), I entered a limit buy order into Interactive Brokers at a "discount." The trade was filled and closed the following day at the profit target.
Interactive Brokers IV Downloader
I retrieve implied volatility data from Interactive Brokers, where it is available free of charge. You can download up to 10 years of historical data. If you're interested in experimenting with the data, you can use my ready-made Python downloader, which I share (with supporters) in the article Interactive Brokers IV Downloader.
Conclusion
The approach of timing mean reversion strategies using implied volatility appears promising. I have incorporated it into my own portfolio and have observed encouraging results. I particularly appreciate that this method brings diversification into my portfolio, as the timing is not based on typical technical analysis. It's definitely worth experimenting with this method to see how it fits into your trading strategies.
For those interested in exploring this approach further, you can find a complete Python script at the link above, which allows you to download IV data from Interactive Brokers. If you have access to IB and a platform capable of backtesting, you can verify the validity of this idea yourself.
Updated statistics for a similar strategy we trade live: Deep Dip - Innovative Short-Term Mean Reversion

![Day Trading Volatility Breakouts Systematically [All Rules Included]](/content/images/size/w960/format/webp/2024/10/breakout-portfolio.jpg)
