The Relative Strength Index (RSI) is one of the most influential technical indicators employed by traders to analyze financial markets. Developed by J. Welles Wilder in 1978, the RSI measures the velocity and magnitude of price movements. This momentum oscillator assists in identifying overbought and oversold conditions in the market, which can be effectively leveraged for entries into mean reversion strategies—such as buying the dips.
How RSI Works
The RSI oscillates between values of 0 and 100. Generally, readings above 70 indicate that an asset is overbought and may be due for a downward price correction. Conversely, readings below 30 suggest that the asset is oversold and that the price might soon rebound upward.
Detailed RSI Calculation
Calculating the RSI involves several steps:
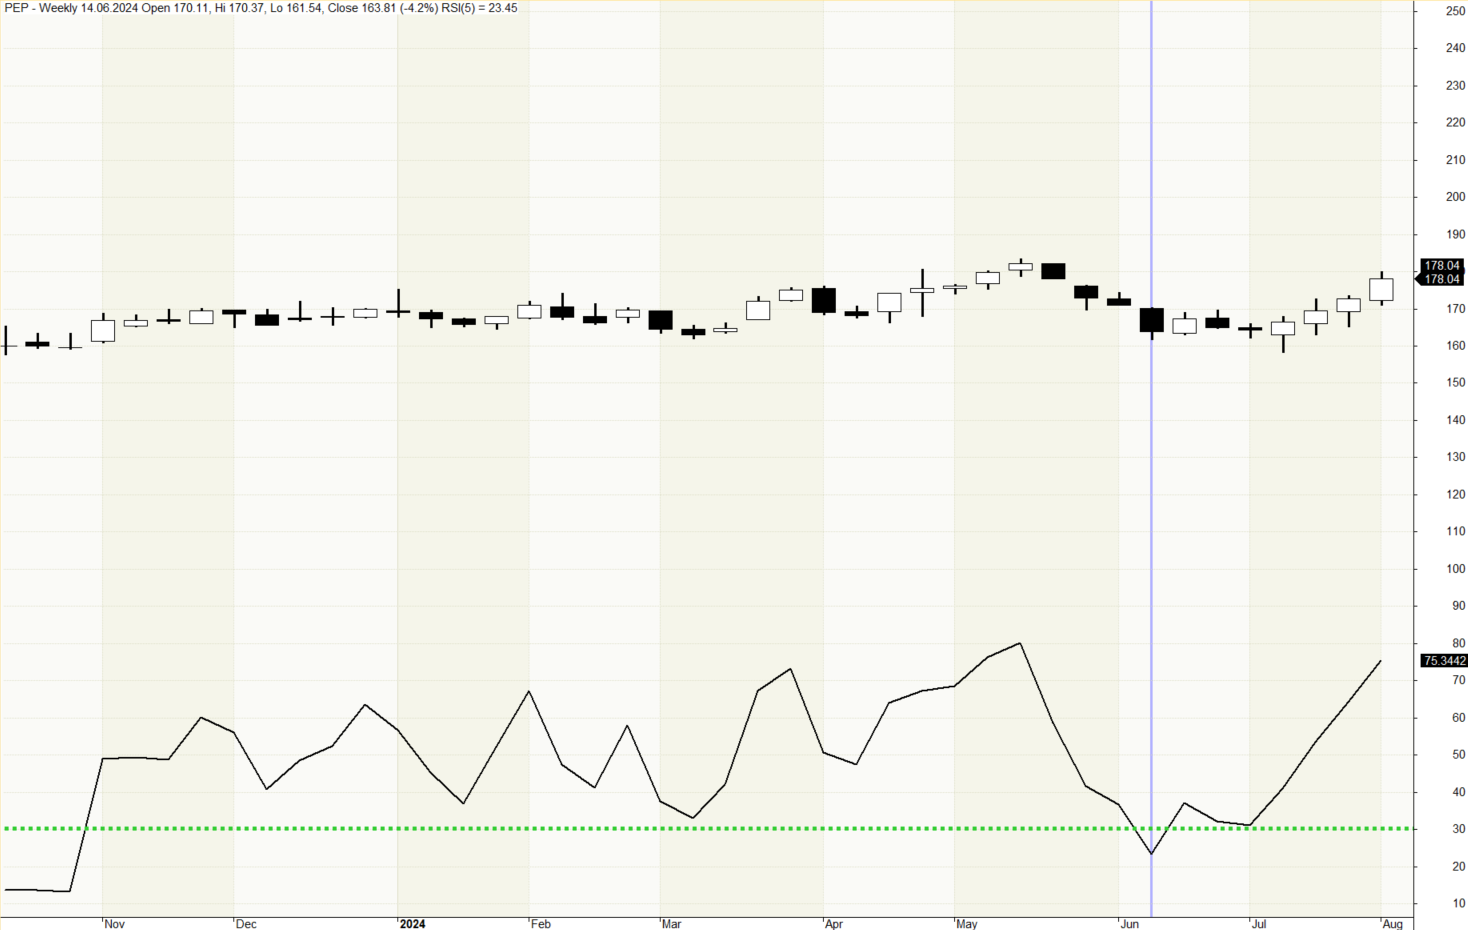
- Determine the Period: The standard setting is a 14-period timeframe (e.g., days), but traders may adjust the period based on their strategies. At CrackingMarkets, we often work with shorter periods and apply the indicator to higher timeframes (see our Buy the Dip Weekly model).
- Calculate Average Gain and Average Loss:
- Average Gain: Sum of all positive price changes over the selected period divided by the number of periods.
- Average Loss: Sum of all negative price changes over the selected period divided by the number of periods.
- Calculate the Relative Strength
\( RS = \frac{\text{Average Gain}}{\text{Average Loss}} \)
- Calculate the RSI:
\( \text{RSI} = 100 - \left( \frac{100}{1 + \text{RS}} \right) \)
Example of RSI Calculation
Assume we have the following data for the last 14 days:
- Days with price increases: Sum of gains = 70 (e.g., 5 units gain per day)
- Days with price decreases: Sum of losses = 30
Average Gain:
\( \text{Average Gain} = \frac{70}{14} = 5 \)
Average Loss:
\( \text{Average Loss} = \frac{30}{14} \approx 2.14 \)
RS:
\( \text{RS} = \frac{5}{2.14} \approx 2.34 \)
RSI:
\[ \begin{align*} \text{RSI} &= 100 - \left( \frac{100}{1 + 2.34} \right) \\ &= 100 - \left( \frac{100}{3.34} \right) \\ &\approx 100 - 29.94 \\ &\approx 70.06 \end{align*} \]
An RSI value of approximately 70 indicates that the asset is nearing overbought territory.
Using RSI for Buying Dips
"Buying the dips" refers to entering a long position following a short-term price decline within an overall uptrend. When the RSI falls below 30, it signals oversold conditions and a potential upward reversal. Traders can capitalize on this scenario by purchasing the asset at a discounted price, anticipating a return to the prevailing uptrend.
An example of a weekly chart of PEP stock with the RSI indicator calculated over a 5-day period applied. The area where the RSI drops below 30 can signal an attractive buying opportunity.